
ChatViz
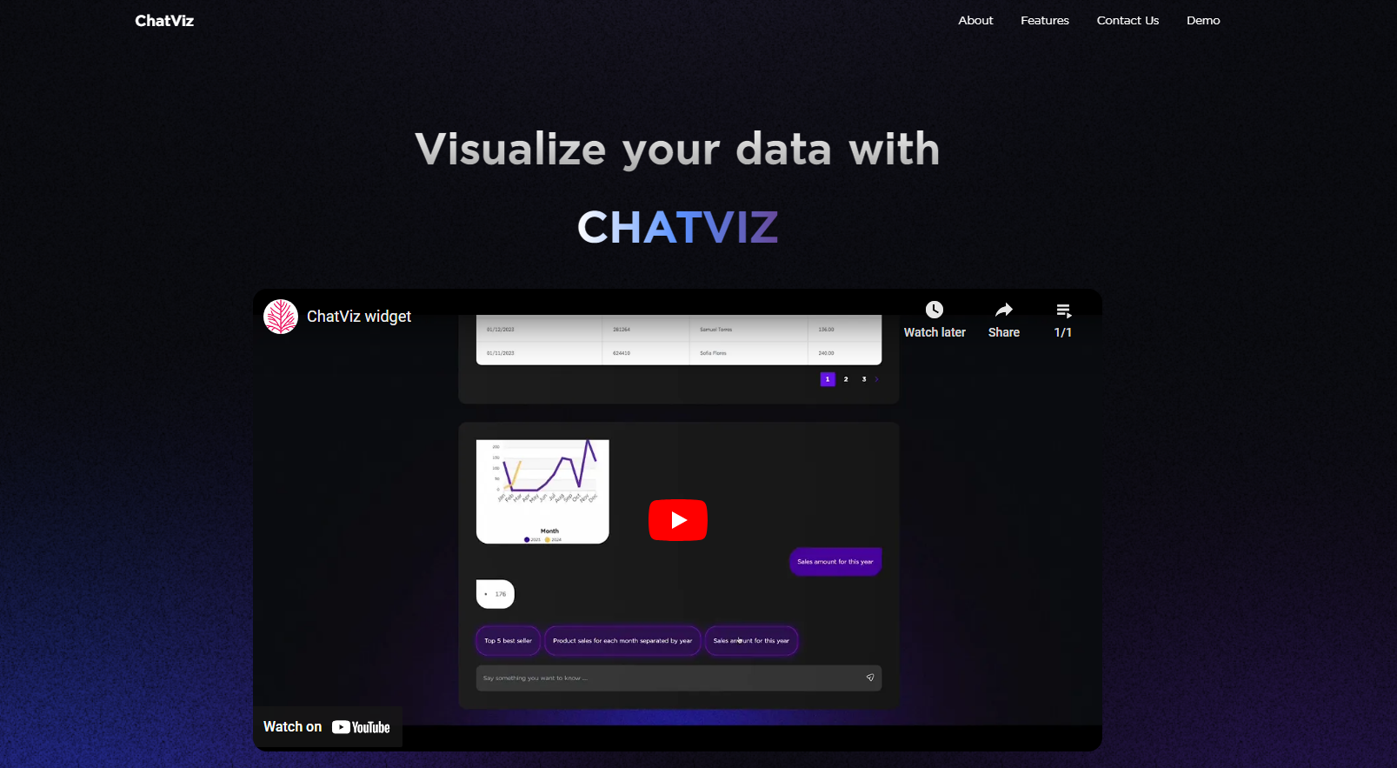
ChatViz is a tool designed to strengthen data visualization capabilities using ChatGPT. It possesses two core features. The first, an SQL translator, takes user input commands and rapidly creates the matching SQL queries.
This streamlines the interaction between the user and their SQL database, as it lowers the necessity for extensive SQL knowledge. The second feature is an automated chart generator that can suggest charts most suited to a specific dataset provided by the user.
This feature simplifies the process of selecting the most appropriate data representation format. Using ChatViz can improve user experience during data visualization and hastens the implementation process.
Offering a solution to the often faced dashboard complexity, it introduces a novel way to visualize data. The tool consists of a configurable ChatViz widget.
To use this tool, the user needs to configure their SQL schema to ChatViz and set up a webhook to communicate with ChatViz. After doing so, ChatViz will visualize the output data from the webhook.
This approach aims to decrease development time by automating the process of data visualization.
Releases
Pricing
Prompts & Results
Add your own prompts and outputs to help others understand how to use this AI.
-
68,677511v2.5 released 1mo agoFrom $500/mo

-
 Build smarter AI voice agents with the best speech recognition technologyOpen17,61320Released 1mo agoFree + from $0.24

Pros and Cons
Pros
View 13 more pros
Cons
View 5 more cons
7 alternatives to ChatViz for Data visualization
-
 Chat with your data to get beautiful visualization.34,295175v2.0 released 7mo agoFree + from $75/yr
 -
 Smart insights for business, stunning visuals for creators.27,05996Released 4mo ago100% FreeI felt there is need of more ready made templates. But, it does what it claims. I chose one question suggested by the AI agent, and it created the infographics in few seconds. It's cool. Saving it for future reference.
 -
 Turn Data into Stunning Charts in Seconds20,99023Released 2mo agoFree + from $20/moI was just trying to get a quick graph showing population evolution over the last 30 years, didn’t have the dataset ready, so I was hoping the tool could auto-fill something reasonable. But it literally gave me three values. Three?? For 30 years?? What kind of trend can I possibly see with that? If the tool offers to research the data, it should at least offer a full timeline. And when I pasted the data I found, it created a literally bar chart???
 -
 Generate visualizations from data using AI4,06821Released 2y ago100% Free
 -
 Supercharge Power BI dashboards with AI-driven insights3,65636Released 2y agoFree + from $15/mo
 -
 Turn complex data into clear insights with AI.2,71351Released 1y agoFree + from $10/mo
 -
 Visualize your data instantly with AI-generated dashboards.1,78619Released 1y agoFree + from $7/mo


Q&A
If you liked ChatViz
Featured matches
-
12,562109Released 23d agoNo pricing
 The leading generative media models on fal combined with top-earning real-world creative talent on Contra is a powerful combination. Feedback to fuel the future of creative ai.
 -
18,50146v2.2 released 1mo agoFree + from $11.48/mo

-
5,33819Released 2mo agoNo pricing

-
9,2816Released 1d agoFree + from $5/mo


Verified tools
-
20,48486Released 2y agoNo pricingI really value the sentiment analysis tool—it simplifies understanding customer feedback by picking up on their emotions. Plus, the way it groups comments into topics is super helpful for decision-making.


How would you rate ChatViz?
Help other people by letting them know if this AI was useful.